Tutorial#
Creating Closed Shapes#
import gbox as gb
from os import path
import matplotlib.pyplot as plt
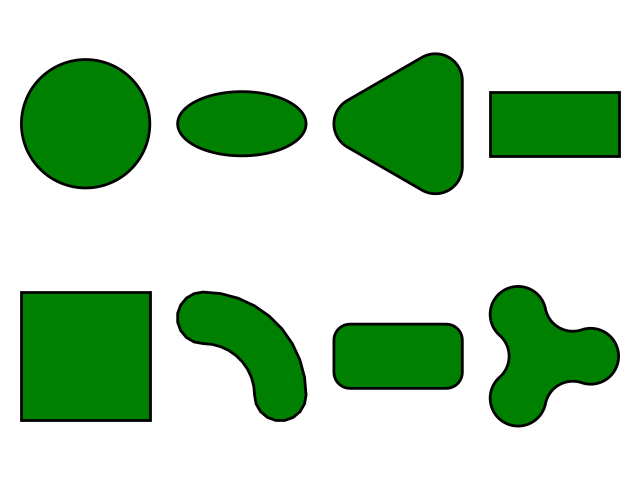
fig, axs = plt.subplots(2, 4)
gb.Circle().plot(axis=axs[0, 0])
gb.Ellipse().plot(axis=axs[0, 1])
gb.RegularPolygon(3).plot(axis=axs[0, 2])
gb.Rectangle().plot(axis=axs[0, 3])
gb.BoundingBox2D().plot(axis=axs[1, 0])
gb.CShape().plot(axis=axs[1, 1])
gb.Capsule().plot(axis=axs[1, 2])
gb.NLobeShape(3).plot(axis=axs[1, 3])
plt.tight_layout()
plt.savefig(path.join(path.dirname(__file__), "shapes.pdf"))
plt.close()
It produces the following figure